The Data Normalization Problem: Why AWS and GCP Billing Don’t Speak the Same Language
The first roadblock in any manual multi-cloud cost reconciliation is the data itself. AWS and Google Cloud report usage and costs in fundamentally different structures. AWS provides the Cost and Usage Report (CUR), a highly detailed CSV file delivered to an S3 bucket. GCP, on the other hand, exports granular billing data directly into a BigQuery dataset. Merging these two sources is not a simple VLOOKUP; it’s a data engineering task that requires normalizing dozens of columns with different naming conventions, pricing models, and resource identifiers.
For instance, an EC2 instance’s cost is broken down by `lineItem/UsageType`, while a GCP Compute Engine VM uses SKUs. This discrepancy means a team needs to build and maintain a complex mapping layer just to answer a basic question: “How much did our compute cost last month across both providers?”
I often run this AWS CLI command on a Monday morning just to see the unblended costs for a specific service, which is the first step in a long manual process.
# Get unblended cost for Amazon EC2 over the last month
aws ce get-cost-and-usage \
--time-period Start=$(date -v-1m +%Y-%m-01),End=$(date +%Y-%m-01) \
--granularity MONTHLY \
--metrics "UnblendedCost" \
--filter '{ "Dimensions": { "Key": "SERVICE", "Values": [ "Amazon Elastic Compute Cloud - Compute" ] } }'
Comparing that output to GCP requires a completely different toolset and mindset. You’re not filtering a report; you’re querying a database.
Achieving True Multi-Cloud Cost Reconciliation
Beyond raw data formats, the next challenge is semantic consistency. A `project` tag in GCP serves a different organizational purpose than an `account` tag in AWS. A unified tagging strategy is the textbook solution, but in practice, it often breaks down. Different teams, legacy resources, and acquisitions lead to inconsistent tagging, making it impossible to allocate costs accurately without significant manual intervention. This is where many teams discover their cloud bill keeps growing even when usage doesn’t; the costs are simply unallocated and unmanaged.
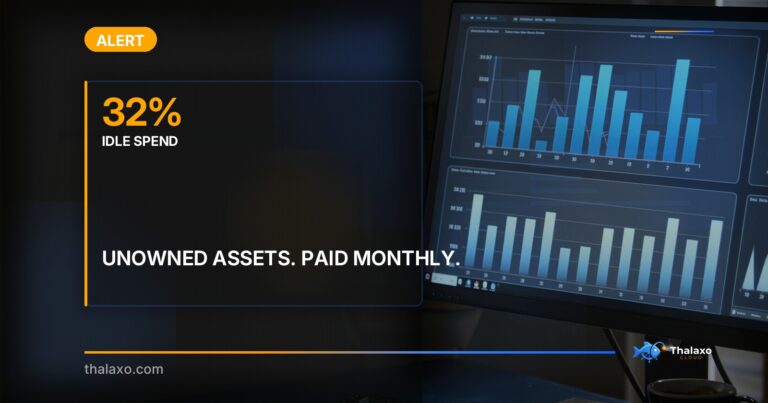
The reconciliation process involves manually mapping provider-specific services (e.g., AWS RDS to GCP Cloud SQL), normalizing cost-saving instruments (Reserved Instances vs. Committed Use Discounts), and allocating shared service costs like networking or Kubernetes clusters. This process is fragile, time-consuming, and prone to human error. According to the FinOps Foundation State of FinOps 2024, the average cloud waste detected is 32%, a figure often hidden within the complexity of multi-cloud billing.
Here’s a basic gcloud command to query your GCP billing data in BigQuery. Notice how different the approach is from the AWS CLI—this is the core of the reconciliation challenge.
# Query total cost by SKU description from your GCP billing export table
gcloud beta billing projects get-billing-info PROJECT_ID --format="value(billingAccountName)" # First get your billing account ID
bq query --use_legacy_sql=false \
'SELECT sku.description, SUM(cost) as total_cost \
FROM `your_billing_project.your_dataset.gcp_billing_export_v1_XXXXXX_XXXXXX_XXXXXX` \
GROUP BY 1 ORDER BY total_cost DESC LIMIT 10'
From Manual Spreadsheets to Automated FinOps Platforms
For a small setup on a single cloud, native tools like AWS Cost Explorer or GCP’s Billing reports are adequate. However, they offer zero visibility into other providers. At the point where a team is spending three days a month exporting CSVs and wrestling with spreadsheets, the cost of manual reconciliation outweighs the benefits. This is the inflection point where a dedicated FinOps platform becomes necessary.
Automated platforms solve the core data ingestion and normalization problem. They connect to billing APIs from multiple providers, including AWS, GCP, and Azure, and present the data in a unified dashboard. This eliminates the manual ETL work and provides a single source of truth for all cloud spending. Thalaxo is built for this specific problem, ingesting disparate billing files and normalizing them into a single, queryable data model. It allows teams to allocate costs based on consistent, cross-cloud business dimensions rather than provider-specific tags.
As a newer platform launched in 2025, Thalaxo’s SOC 2 Type II audit is currently in progress (started June 2026), and workload-level Kubernetes cost allocation is on the public roadmap for Q3 2026. For organizations with deep, single-provider dependencies and heavy Kubernetes usage today, native tools combined with solutions like Kubecost might offer more immediate depth. However, for the growing number of teams struggling with the sheer manual effort of multi-cloud reporting, automation provides an immediate and significant ROI. You can explore the different tiers on our pricing page.
Conclusion: Stop Reconciling, Start Optimizing
Spending days each month on manual multi-cloud cost reconciliation is a defensive, low-value activity. It keeps FinOps teams trapped in reporting cycles instead of focusing on strategic optimization like rightsizing or shutting down idle resources. The goal is not to become an expert at joining AWS and GCP billing files; the goal is to get a clear, accurate view of total cloud spend with minimal effort. Automating the ingestion, normalization, and allocation of cost data is the first and most critical step to scaling a FinOps practice in a multi-cloud environment. Platforms like Thalaxo automate these foundational checks, freeing up engineers to focus on value-driven optimization rather than data janitorial work.